Istio End to End: Install, Canary, Lock Down, Monitor
Most Istio tutorials stop after istioctl install and a green check. That leaves you with an encrypted cluster, a pile of CRDs whose names give you no hint which does what, and no idea how to ship a canary or refuse a caller. This guide goes all the way through: install, one canary, one authorization policy, one failing dependency survived, and two layers of monitoring.
Then it does something the Linkerd version of this guide could not. It converts the finished mesh to ambient mode and re-runs all four scenarios, because three of them silently stop working and nothing tells you. Budget about ninety minutes on a kind cluster. Every command below was run against Istio 1.30.3 on Kubernetes 1.35, and every number is measured rather than quoted.
Before you start
- A Kubernetes cluster you can install CRDs into. Two nodes is plenty.
kubectlandhelmalready on your path.- An app with at least two services. Mine is a backend serving one line of text in two versions, a
go-httpbindeployment for producing failures on demand, and acurlpod as the client.
The istioctl CLI is the one tool you probably do not have:
curl -L https://istio.io/downloadIstio | ISTIO_VERSION=1.30.3 sh -
export PATH=$PWD/istio-1.30.3/bin:$PATH
istioctl version --remote=false
Pin the version. Without ISTIO_VERSION the installer resolves the latest release by scraping the GitHub releases page, so the same command run two months apart gives you two different builds. I read the script to confirm that rather than assuming it.
One decision to make before anything else, because retrofitting it is annoying: give every workload its own ServiceAccount. All three major meshes derive workload identity from it. Leave everything on default and “allow the client” quietly means “allow anything in this namespace”, which is not a policy.
Here is the shape of the app, trimmed to the parts that matter. Deploy it unmeshed first and enroll it in Step 2, so you can see what the mesh changes:
apiVersion: v1
kind: ServiceAccount
metadata: { name: backend, namespace: shop }
---
apiVersion: apps/v1
kind: Deployment
metadata: { name: backend-v1, namespace: shop }
spec:
  selector:
    matchLabels: { app: backend, version: v1 }
  template:
    metadata:
      labels: { app: backend, version: v1 }
    spec:
      serviceAccountName: backend
      containers:
        - name: nginx
          image: nginx:1.27-alpine
          readinessProbe:
            httpGet: { path: /, port: 80 }
---
apiVersion: v1
kind: Service
metadata: { name: backend, namespace: shop }
spec:
  selector: { app: backend }        # both versions, on purpose
  ports: [{ name: http, port: 80, targetPort: 80 }]
backend-v2 is the same with version: v2 and a different response body. The client is a curl image sleeping forever, with its own ServiceAccount. For Step 7 you also want something that fails on demand: mccutchen/go-httpbin serves /delay/5 and /status/200,503 and saves you writing one.
Step 1 - Install Gateway API first, because nothing will tell you to
Linkerd refuses to install without the Gateway API CRDs and prints the exact command to fix it. Istio does not. istioctl x precheck passed cleanly on an empty cluster with no Gateway API CRDs anywhere:
✔ No issues found when checking the cluster. Istio is safe to install or upgrade!You still need them, for the canary in Step 4 and the ingress in Step 6. Take the version from Istio, not from the Gateway API project. The current Gateway API release is v1.6.1, but Istio 1.30.3’s own docs pin v1.5.1, and mixing those is a bad way to spend an afternoon:
kubectl apply --server-side -f https://github.com/kubernetes-sigs/gateway-api/releases/download/v1.5.1/standard-install.yaml
istioctl install --set profile=minimal -y
I used minimal rather than default deliberately. The default profile also installs istio-ingressgateway, a legacy component that Gateway API replaces: gateways get provisioned per Gateway resource in Step 6, so that pod sits there doing nothing. Later, when I installed the ambient profile over the top, Istio pruned it on its own, which is a reasonable second opinion.
The check worth running is not a pod count:
kubectl get gatewayclassNAME CONTROLLER ACCEPTED
istio istio.io/gateway-controller TrueStep 2 - Enroll your app
Injection is a namespace label plus a restart. Nothing rewrites running pods:
kubectl label namespace shop istio-injection=enabled
kubectl -n shop rollout restart deploy
Pods come back 2/2. One thing that surprised me on Kubernetes 1.35: the proxy is a native sidecar, so it is an initContainer, not a regular container.
kubectl -n shop get pod -l app=client -o jsonpath='{.items[0].spec.initContainers[*].name}'istio-init istio-proxyIf you have scripts grepping .spec.containers for istio-proxy, they now find nothing while the mesh works fine.
Confirm the identities are distinct, because everything in Step 5 depends on it:
istioctl proxy-config secret <pod>.shop -o json | ... # extract the cert, read the SANURI:spiffe://cluster.local/ns/shop/sa/client
URI:spiffe://cluster.local/ns/shop/sa/backend
URI:spiffe://cluster.local/ns/shop/sa/intruderThree workloads, three identities. If that reads sa/default for every pod, go back and fix your ServiceAccounts now. Note the shape, because policy drops the spiffe:// scheme and writes cluster.local/ns/shop/sa/client.
Step 3 - Get metrics early, which on Istio means installing Prometheus
This is the sharpest difference from Linkerd, and it is worth knowing before you plan your afternoon. linkerd viz install gives you golden metrics per workload in one command. Istio ships no equivalent. What you get is the raw Envoy endpoint on every pod:
kubectl -n shop exec <pod> -c istio-proxy -- curl -s localhost:15020/stats/prometheusThat is 614 metric lines per pod, unaggregated. The mesh’s own layer is one useful command, and it reports config convergence rather than traffic:
istioctl proxy-statusNAME CLUSTER ISTIOD VERSION SUBSCRIBED TYPES
backend-v1-...shop Kubernetes istiod-68fdb6dd64-kbbgm 1.30.3 4 (CDS,LDS,EDS,RDS)
client-...shop Kubernetes istiod-68fdb6dd64-kbbgm 1.30.3 4 (CDS,LDS,EDS,RDS)Use it whenever a config change seems not to have landed. For actual numbers, skip to Step 8 and install Prometheus now if you want graphs while you work through the rest.
The mTLS number lies, and it lies differently than Linkerd’s does
Worth catching on your first day rather than your first incident. Here are the same 32 requests, read from the two proxies that saw them:
| reporter | connection_security_policy |
count |
|---|---|---|
source |
unknown |
32 |
destination |
mutual_tls |
32 |
The sending proxy does not record what security policy was used. So a panel built across both reporters undercounts, badly. On the finished lab under load:
| query | reading |
|---|---|
mutual_tls / all, no reporter filter |
64.93% |
the same, scoped to reporter="destination" |
99.90% |
Thirty-five points of nothing. Scope every security panel to reporter="destination". Linkerd has the same trap for a different reason, and wants direction="outbound" instead.
Prove the encryption instead of trusting it
A dashboard reading 99.9% is a claim about a label. I ran tcpdump on the node instead, with a marker string in a header, and looked for it in the clear.
Run the positive control first. A capture that never started reports zero markers, and zero markers is also what success looks like. Istio’s default PERMISSIVE mode makes the control easy to arrange: an unmeshed pod can talk plaintext straight to the backend pod IP and be served.
| run | packets | marker in clear | plaintext GET |
|---|---|---|---|
| unmeshed caller, direct to pod IP | 54 | 5 | 10 |
| through the mesh, 40 requests | 114 | 0 | 0 |
My first meshed run captured only 6 packets, because the backend Service balances across two pods and the capture watches one pod IP. Six packets and zero markers is indistinguishable from a broken capture, so I repeated it at 40 requests to get comparable volume before believing the zero.
Absence of the marker is weak evidence on its own, so I also looked for positive proof: 98 TLS 1.3 application-data records (17 03 03) with ciphertext payloads. That is the mesh doing its job, visible in the bytes.
Where each object attaches
Four features, and the object names give you no hint which is which. Worse than Linkerd here, because two different APIs compete for the same attachment point.
The part that catches people: HTTPRoute and VirtualService both attach to the Service and do overlapping jobs. You pick one. Gateway API is portable and has no retries, so the moment you need retries it pulls you back to VirtualService.
Step 4 - Ship a canary
Istio has its own traffic splitting object and every tutorial reaches for it. It does not need to. Istio implements GAMMA, so the portable Gateway API object works, and I used the same file the Linkerd guide used.
HTTPRoute backendRefs point at Services, not label subsets, so each version needs its own Service. The original backend Service stays as the address clients call and becomes the route’s parent:
apiVersion: gateway.networking.k8s.io/v1
kind: HTTPRoute
metadata: { name: backend-canary, namespace: shop }
spec:
  parentRefs:
    - { name: backend, kind: Service, group: "", port: 80 }
  rules:
    - backendRefs:
        - { name: backend-v1, port: 80, weight: 90 }
        - { name: backend-v2, port: 80, weight: 10 }
That group: "" is load bearing and cost me a debugging round. Gateway API spells the core API group as the empty string. I wrote group: core, which Linkerd tolerates, and Istio did not:
parentRefs[0].group |
route status | measured split, 200 requests |
|---|---|---|
core |
parents: [] |
100 / 100, plain round-robin |
"" |
Accepted=True |
173 / 27 |
There is no error and no event anywhere. The route simply is not claimed by any controller, and the Service carries on doing what it always did. Always read the route status back:
kubectl -n shop get httproute backend-canary -o yaml | sed -n '/^status:/,$p'Now the split itself. Weighted routing is statistical, not a quota, and small samples mislead:
| weights | requests | measured |
|---|---|---|
| 90 / 10 | 200 | 173 / 27 (86.5 / 13.5) |
| 90 / 10 | 1000 | 899 / 101 (89.9 / 10.1) |
| 50 / 50 | 500 | 241 / 259 |
| 0 / 100 | 500 | 0 / 500 |
At 200 requests it looks 3.5 points off and you start doubting the config. At 1000 it lands where you asked. Weight 0 is a hard zero, so that is your rollback.
Step 5 - Refuse an unauthorized caller
Three objects, and the middle one is the one people skip.
PeerAuthentication decides whether a caller may speak at all. AuthorizationPolicy decides who, having spoken, gets through. Getting only the first is the common half-configured state: every connection encrypted, every workload still able to call every other workload.
apiVersion: security.istio.io/v1
kind: PeerAuthentication
metadata: { name: shop-strict, namespace: shop }
spec:
  mtls: { mode: STRICT }
---
apiVersion: security.istio.io/v1
kind: AuthorizationPolicy
metadata: { name: deny-all, namespace: shop }
spec: {}                      # empty spec = allow nothing, namespace wide
---
apiVersion: security.istio.io/v1
kind: AuthorizationPolicy
metadata: { name: backend-allow-client, namespace: shop }
spec:
  selector:
    matchLabels: { app: backend }
  action: ALLOW
  rules:
    - from:
        - source:
            principals: ['cluster.local/ns/shop/sa/client']
Istio’s default is allow-all, so without deny-all the third object grants nothing that was not already permitted and proves nothing.
The control that makes this a real test is the intruder: a second meshed pod in the same namespace with a valid certificate and its own identity. The only thing that can stop it is the policy.
| caller | before | after |
|---|---|---|
| client (allowed principal) | 200 | 200 |
| intruder | 200 | 403 RBAC: access denied |
| backend readiness probe | Ready | Ready |
Do not test this with a single curl. I did, and got a 200 with a body of RBAC: access denied, which is nonsense until you realise the two halves of the command straddled the policy landing. Polling once a second from the intruder while kubectl apply ran, twice:
| run | first 403 | settled | got through after apply |
|---|---|---|---|
| A | +1s | +10s, flapping 200/403 in between | 8 of 55 |
| B | +3s | +3s, clean | 10 of 60 |
Run A flipped back to 200 twice after the first denial. I had a tidy theory about per-pod config convergence, tested it by logging which backend version served each request, and run B refused to reproduce the flapping at all. So I have no mechanism to offer you, only the operational rule: policy takes seconds to land, sometimes unevenly, so verify it from a loop.
One more consequence that will bite in Step 7: deny-all covers workloads you were not thinking about. With it in force, client -> flaky returned 403 and the entire resilience scenario was unreachable until flaky got its own ALLOW rule.
The trap: port 15020 walks straight through all of this
Istio does not exempt your probe path the way Linkerd does. It rewrites the probe to a different port entirely:
readinessProbe.httpGet: { path: /app-health/nginx/readyz, port: 15020 }That is genuinely better in one respect. Kubelet traffic never enters istio_requests_total, so it cannot skew your success rate the way it does on Linkerd.
It costs you something else. With both STRICT mTLS and deny-all in force, I curled the backend pod from a hostNetwork pod with no mesh identity whatsoever:
| target on the backend pod IP | result |
|---|---|
:80, the app port |
connection refused |
:15020/app-health/nginx/readyz |
200, and the full application body |
:15020/stats/prometheus |
200, 283,941 bytes of Envoy metrics |
:15020/quitquitquit |
403 |
The dangerous admin endpoints are gated. The health and stats ports are open by design, because kubelet cannot present a mesh certificate and Prometheus has to scrape something. That design decision is why the scrape job in Step 8 needs no credentials, and it is also a cleartext path to your probe endpoint and a full map of your mesh, for anything that can reach the pod network.
Two fixes, neither of them a mesh policy. Probe a path that returns nothing worth having, such as an empty /healthz, so the leak is worthless. And reach for NetworkPolicy for port 15020, because deny-all in the mesh does not cover a path the mesh is not in.
Step 6 - Let traffic in from outside
No third-party controller needed, which is the main saving over the Linkerd version of this step. Istio registered the istio GatewayClass at install, so applying a Gateway makes istiod provision the data plane for it.
The Gateway is infrastructure:
apiVersion: gateway.networking.k8s.io/v1
kind: Gateway
metadata: { name: shop, namespace: istio-ingress }
spec:
  gatewayClassName: istio
  listeners:
    - name: http
      port: 80
      protocol: HTTP
      hostname: shop.example.com
      allowedRoutes:
        namespaces: { from: All }
The HTTPRoute is application config and lives with the app, parented to that Gateway. Applying the Gateway gets you three objects you did not write:
deployment.apps/shop-istio   1/1
service/shop-istio           LoadBalancer
serviceaccount/shop-istio
The identity is named after the Gateway plus its class, so cluster.local/ns/istio-ingress/sa/shop-istio. Rename the Gateway and the policy you are about to write silently stops matching.
On kind there is no LoadBalancer, so the Service sat <pending> and the Gateway reported PROGRAMMED=False. kubectl port-forward is the quick way through. I also installed MetalLB to check the real path, and it is worth one warning if you are on Windows: MetalLB assigned 172.22.255.200 and the Gateway went PROGRAMMED=True, but that address answered only from inside the cluster network and returned nothing from my host, because the kind network lives inside the WSL2 VM. A real LoadBalancer IP you cannot route to is more confusing than no LoadBalancer at all.
Now send a request from outside and watch Steps 5 and 6 collide:
| from outside, through the Gateway | result |
|---|---|
| with the policy from Step 5 in force | 403 |
| after adding the Gateway’s identity | 200, reached backend v1 |
a request with the wrong Host |
404, refused by the Gateway |
| intruder inside the cluster, same moment | 403 |
That 403 is correct behaviour and worth sitting with. Your gateway is not special. It is another workload with another identity, and a deny-by-default namespace does not know it is an ingress:
principals:
  - 'cluster.local/ns/shop/sa/client'
  - 'cluster.local/ns/istio-ingress/sa/shop-istio'
Keep the 404 row separate in your head. Hostname matching is the Gateway’s job and runs before any mesh policy, so a bad Host never reaches a proxy that could evaluate identity.
Step 7 - Survive a bad dependency
Three mechanisms, three different objects, and only one of them is portable:
| concern | object |
|---|---|
| timeout | Gateway API HTTPRoute, spec.rules[].timeouts.request |
| retry | Istio VirtualService, spec.http[].retries |
| circuit breaking | Istio DestinationRule, trafficPolicy.outlierDetection |
Gateway API’s standard channel has no retry field at all. I checked the installed CRD rather than the docs: a rule accepts backendRefs, filters, matches, name, timeouts and nothing else. So retries mean the experimental channel or an Istio CRD. And since VirtualService and HTTPRoute both want to own the same Service, adding retries in practice means moving the timeout across too:
apiVersion: networking.istio.io/v1
kind: VirtualService
metadata: { name: flaky-resilience, namespace: shop }
spec:
  hosts: [flaky]
  http:
    - timeout: 2s
      retries: { attempts: 3, retryOn: 5xx, perTryTimeout: 1s }
      route:
        - destination: { host: flaky, port: { number: 8080 } }
Keep perTryTimeout inside the outer timeout or the outer one fires first and you never see a retry happen.
| measurement | before | after |
|---|---|---|
/delay/5 with a 2s request timeout |
200 in 4.87s | 504 in 1.95s |
/status/200,503 x30, retry 3 on 5xx |
14/30 succeeded | 30/30 succeeded |
Circuit breaking does not do what you expect
This is where I have to correct the mental model the Linkerd guide leaves you with. Same idea, same thresholds, completely different outcome.
outlierDetection:
  consecutive5xxErrors: 3
  baseEjectionTime: 10s
  maxEjectionPercent: 100
After 30 consecutive 503s, all three flaky endpoints were ejected. I confirmed it two ways, because I did not believe the first one:
istioctl proxy-config endpoint ...   OUTLIER CHECK: FAILED   (all 3)
envoy /clusters                      health_flags::/failed_outlier_check (all 3)
And five healthy requests sent inside that same window all returned 200. Linkerd’s breaker refuses healthy requests while the penalty lasts. Istio’s ejected every endpoint and kept serving through them anyway.
The reason is Envoy’s healthy panic threshold, which defaults to 50%: once fewer than half the hosts are healthy, Envoy stops trusting the health data and load balances across everything. Ejecting 3 of 3 puts you at zero. I could not read the lb_healthy_panic counter to prove it directly, because Istio’s default stats filter drops outbound cluster stats, so treat that as the documented explanation for a measured behaviour rather than a second measurement.
The practical takeaway does not depend on the mechanism: outlier detection sheds load when a minority of your endpoints are bad. It is not a stop-everything breaker. Unless you run ambient, where it is. That is Step 9.
Step 8 - Monitoring you can keep
kube-prometheus-stack, trimmed to Prometheus and Grafana. The Istio-specific part is smaller than Linkerd’s, because Istio’s injector writes the scrape annotations for you:
prometheus.io/scrape = true
prometheus.io/path   = /stats/prometheus
prometheus.io/port   = 15020
So the scrape job is the generic annotation-driven one. Which is exactly the problem, and every Istio tutorial gets this wrong. Those annotations are a general convention, not an Istio one. My cluster had MetalLB in it from Step 6, which advertises the same scrape=true on port 9120:
| scrape job | targets | up | down |
|---|---|---|---|
scrape=true only |
15 | 12 | 3, MetalLB, HTTP 400 |
plus prometheus.io/port == 15020 |
11 | 11 | 0 |
One extra relabel rule:
- source_labels: [__meta_kubernetes_pod_annotation_prometheus_io_port]
  action: keep
  regex: '15020'
Pinning the port also correctly drops istiod, which annotates 15014 and deserves its own job. One gotcha on top: additionalScrapeConfigs lands in a Secret that Prometheus mounts, and helm upgrade alone was not enough. The running instance served the old config until I restarted the pod.
Your success rate panel counts denials as successes
Istio records an RBAC denial as an ordinary response_code="403". So the usual “success is anything that is not a 5xx” definition scores every intruder you correctly blocked as a success:
| definition | reading on the same data |
|---|---|
| non-5xx | 90.60% |
| 2xx only | 69.22% |
Twenty-one points, entirely from traffic the mesh was refusing on purpose. Define success as 2xx and put denials in their own panel, because a success-rate number can only ever hide them.
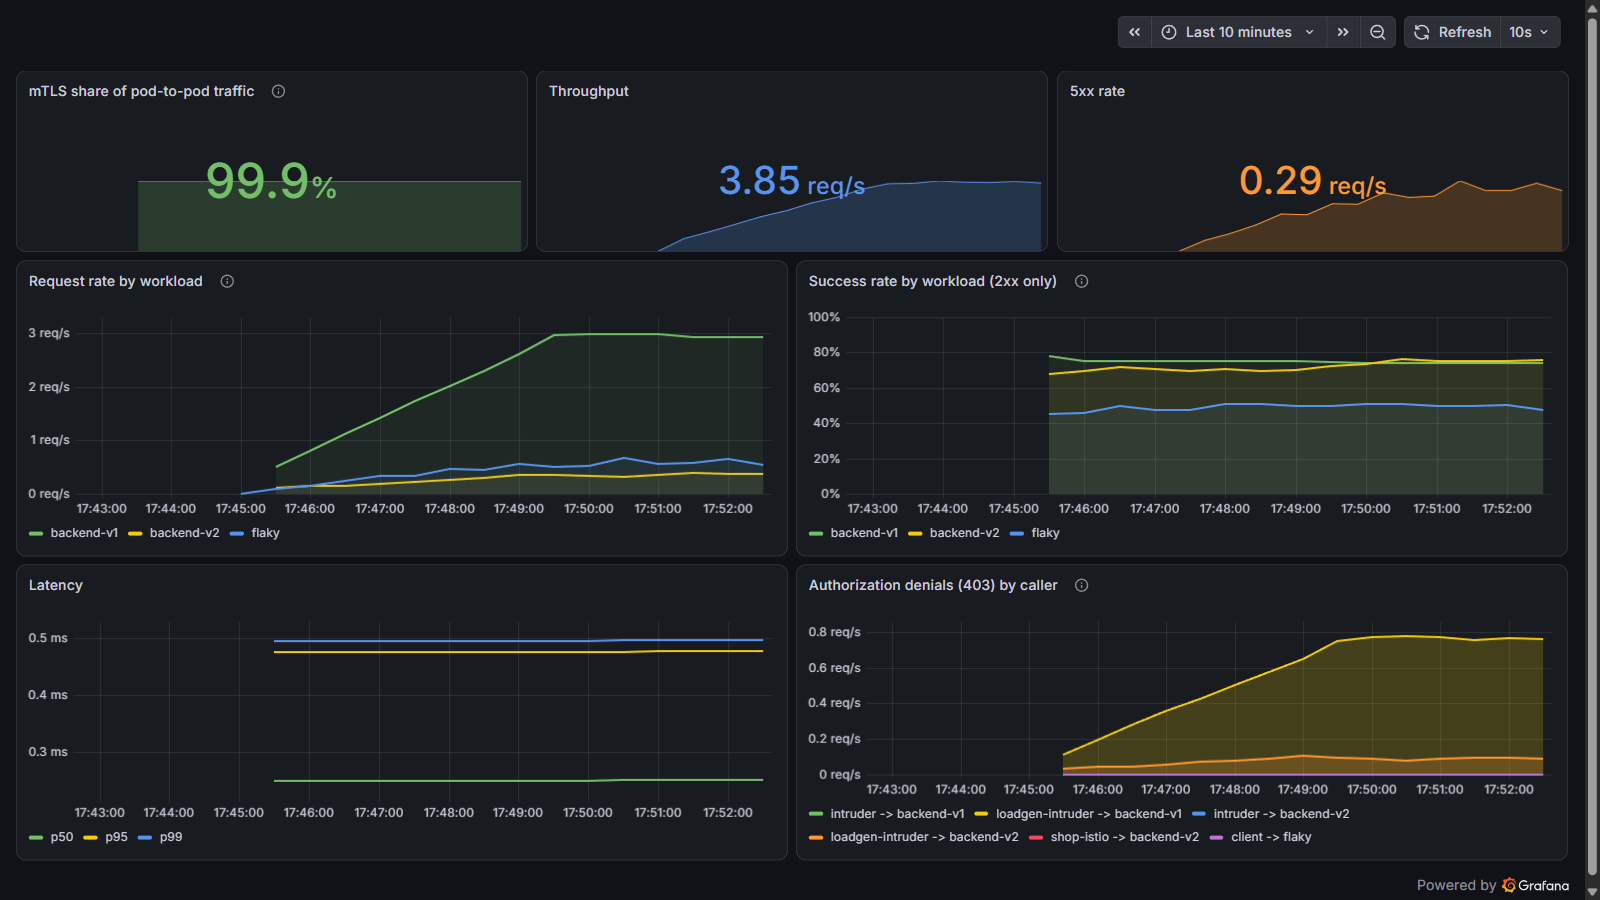
Step 9 - Now convert it to ambient and watch half of it stop working
Ambient mode replaces per-pod sidecars with a per-node ztunnel for L4, plus an optional waypoint proxy for L7. I converted this same cluster in place, because that is the migration you would actually face:
istioctl install --set profile=ambient -y
kubectl label namespace shop istio-injection-
kubectl label namespace shop istio.io/dataplane-mode=ambient
kubectl -n shop rollout restart deploy
Pods come back 1/1. Every workload shows up in istioctl ztunnel-config workload with protocol HBONE and, importantly, WAYPOINT: None.
Then I re-ran all four scenarios without changing a single config object:
| scenario | sidecar | ambient, no waypoint |
|---|---|---|
| canary 90/10 | 899/101 | 28/32, route ignored |
| lockdown, intruder | 403 | connection refused |
ingress, right / wrong Host |
200 / 404 | 200 / 404 |
/delay/5 with 2s timeout |
504 in 1.95s | 200 in 4.86s, ignored |
/status/200,503 x30 with retry |
30/30 | 17/30, ignored |
Nothing errored or warned, and every object still reported Accepted=True. Three of the four scenarios just quietly went away, because they are L7 and there is no L7 proxy left in the path.
Two details worth pulling out. Authorization still works, because ztunnel enforces identity at L4, but the intruder is now refused by a dropped connection rather than a 403, so anything alerting on 403 rate goes quiet. And load balancing moves from per-request to per-connection:
| method | result |
|---|---|
| 60 requests, separate connections | 28 / 32 |
| 60 requests, one reused connection | 60 / 0 |
A keepalive client now pins to one pod for the life of the connection.
Adding a waypoint breaks everything, and the obvious fix opens the door
istioctl waypoint apply -n shop --enroll-namespaceImmediately after, every request returned 503 upstream connect error. The waypoint could not reach the backend, because deny-all did not name it. The natural fix is to add the waypoint’s identity to the allow rule. That gave me:
client   -> 200
intruder -> 200
Wide open. With a waypoint in the path, the backend’s ztunnel evaluates the waypoint’s identity, not the caller’s. Allowing the waypoint allows everything that can reach the waypoint. The policy still exists, still names one principal, and enforces nothing.
The fix is two policies at two layers, not one policy with two principals:
# L4, on the workload: only the waypoint may connect directly.
spec:
  selector:
    matchLabels: { app: backend }
  rules:
    - from: [{ source: { principals: ['cluster.local/ns/shop/sa/waypoint'] } }]
---
# L7, on the waypoint: only the client may call. targetRefs, not selector.
spec:
  targetRefs:
    - { kind: Gateway, group: gateway.networking.k8s.io, name: waypoint }
  rules:
    - from: [{ source: { principals: ['cluster.local/ns/shop/sa/client'] } }]
That gets you client 200, intruder 403 again, and the 403 is a real HTTP response from the waypoint rather than a reset.
You also have to name the ingress gateway in the L4 policy. A waypoint is a property of the destination namespace and callers reach it because their own ztunnel redirects them there. The Gateway lives outside the ambient namespace, so it has no ztunnel and connects to the pod directly. Leaving it out produced 503s for every external request while internal traffic worked perfectly, which is a miserable place to start debugging.
With the waypoint in place and policy split correctly, the L7 scenarios come back:
| measurement | sidecar | ambient + waypoint |
|---|---|---|
| canary 90/10, 200 requests | 173/27 | 180/20 |
/delay/5 with 2s timeout |
504 in 1.95s | 504 in 1.9465s |
| lockdown, client / intruder | 200 / 403 | 200 / 403 |
Circuit breaking starts working, and your dashboard goes blank
Circuit breaking starts working. The same DestinationRule that did nothing under sidecars opens the circuit under a waypoint:
| step | sidecar | ambient + waypoint |
|---|---|---|
| control | 200 200 200 |
200 200 200 |
| after 30 consecutive 503s | 200 200 200 200 200 |
503 503 503 503 503 |
| after the penalty window | never opened | 200 at t+10s |
Ambient behaves the way the Linkerd guide would lead you to expect. Be aware of the cost: while the circuit was open the waypoint returned 503 in 1.9ms for every request to that Service, healthy ones included.
Your dashboard goes blank. Two silent breakages at once. The scrape annotations came from the sidecar injector, and there is no injector any more, so the job fell from 11 targets to 4: the waypoint, both ztunnels, and the gateway. Every application pod left monitoring.
And the reporter label changes. Running Step 8’s own panel queries, unchanged:
| panel query | ambient result |
|---|---|
reporter="destination" mTLS |
NO DATA |
reporter="destination" throughput |
NO DATA |
the same with reporter="waypoint" |
100.00% and 6.34 req/s |
The correction that made the sidecar dashboard honest is the exact thing that blanks it after conversion. If your dashboard needs to survive a migration, match both: reporter=~"destination|waypoint".
L4 telemetry keeps flowing the whole time. istio_tcp_connections_opened_total read 6.41/s from ztunnel while every HTTP panel was empty. Watch only HTTP and you will conclude the mesh is dead.
Where to go next
The single thing to carry out of this guide: on Istio, the object existing is not the same as the object doing anything. A route with the wrong group reports no status and silently round-robins. A policy that names a waypoint enforces nothing. An L7 config on ambient without a waypoint is inert. A circuit breaker can eject every endpoint and keep serving. None of those print an error, and four of them cost me a debugging round in this lab.
So the one next action is not a feature. Go and read the status back on every routing object you already have in production:
kubectl get httproute -A -o custom-columns=\
'NS:.metadata.namespace,NAME:.metadata.name,PARENTS:.status.parents[*].conditions[?(@.type=="Accepted")].status'
Any row that comes back empty is a config you believe is running and is not.